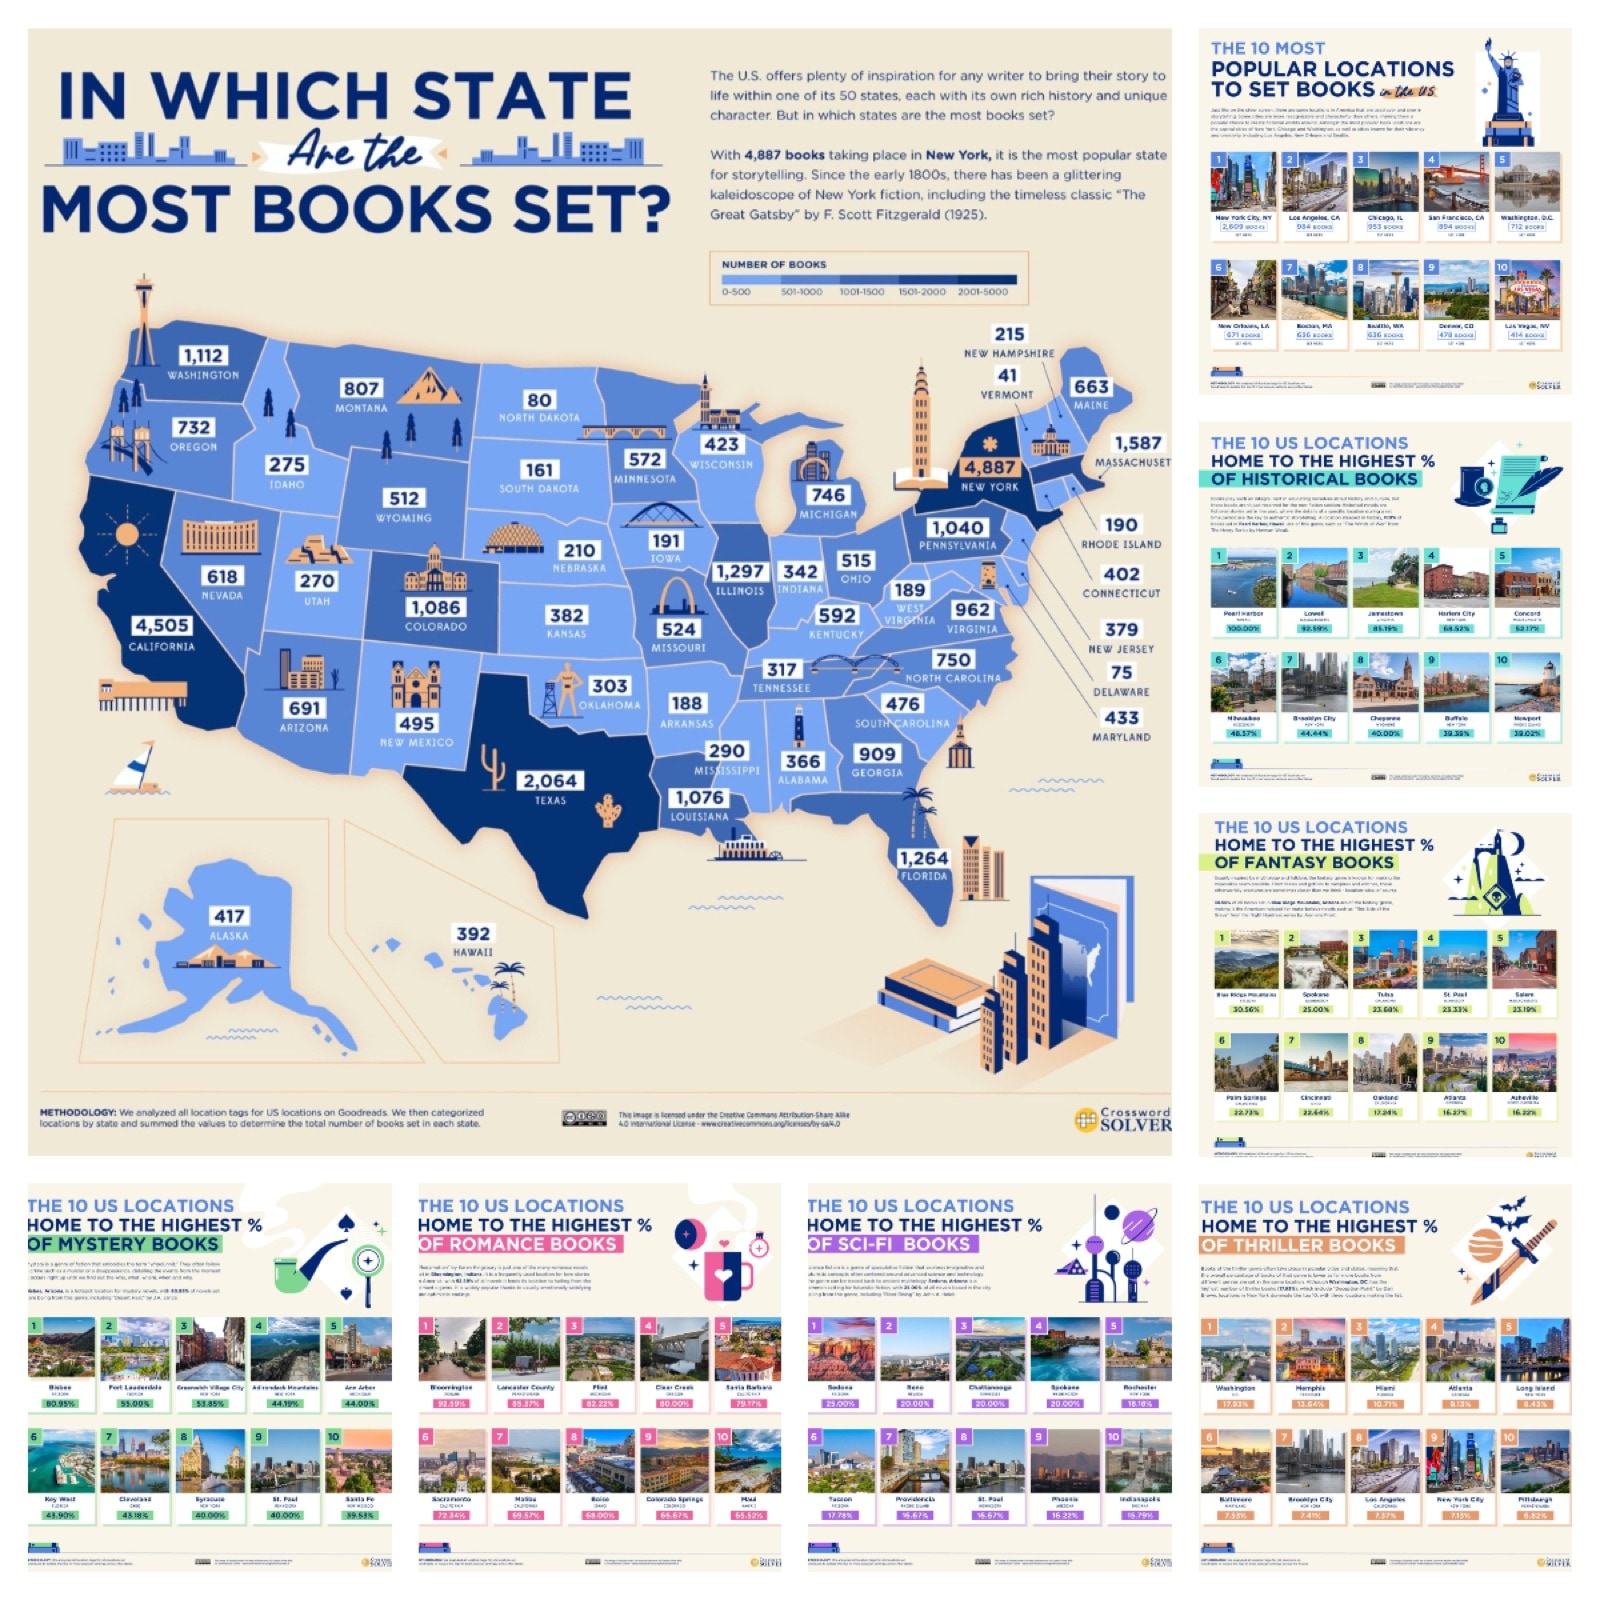
Tag: Infographics
-

Audiobook listening in 2023, according to Spotify
—
by
Spotify’s announcement of the introduction of audiobooks in the U.S. comes with an infographic about audiobook listening habits.
-
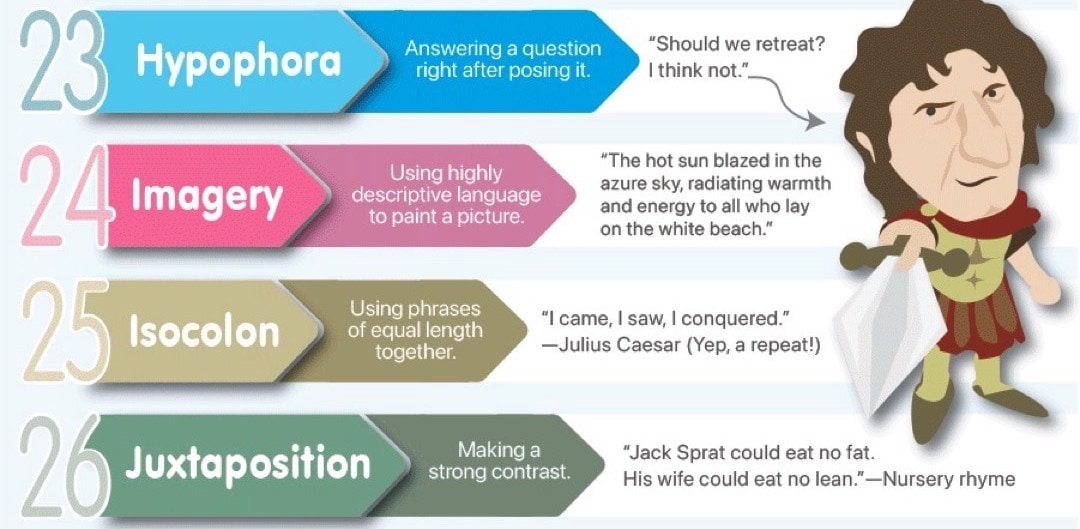
Common literary devices – the ultimate infographic guide
—
by
An infographic from Grammar Check puts together the most common literary devices, together with their short descriptions and example phrases.
-
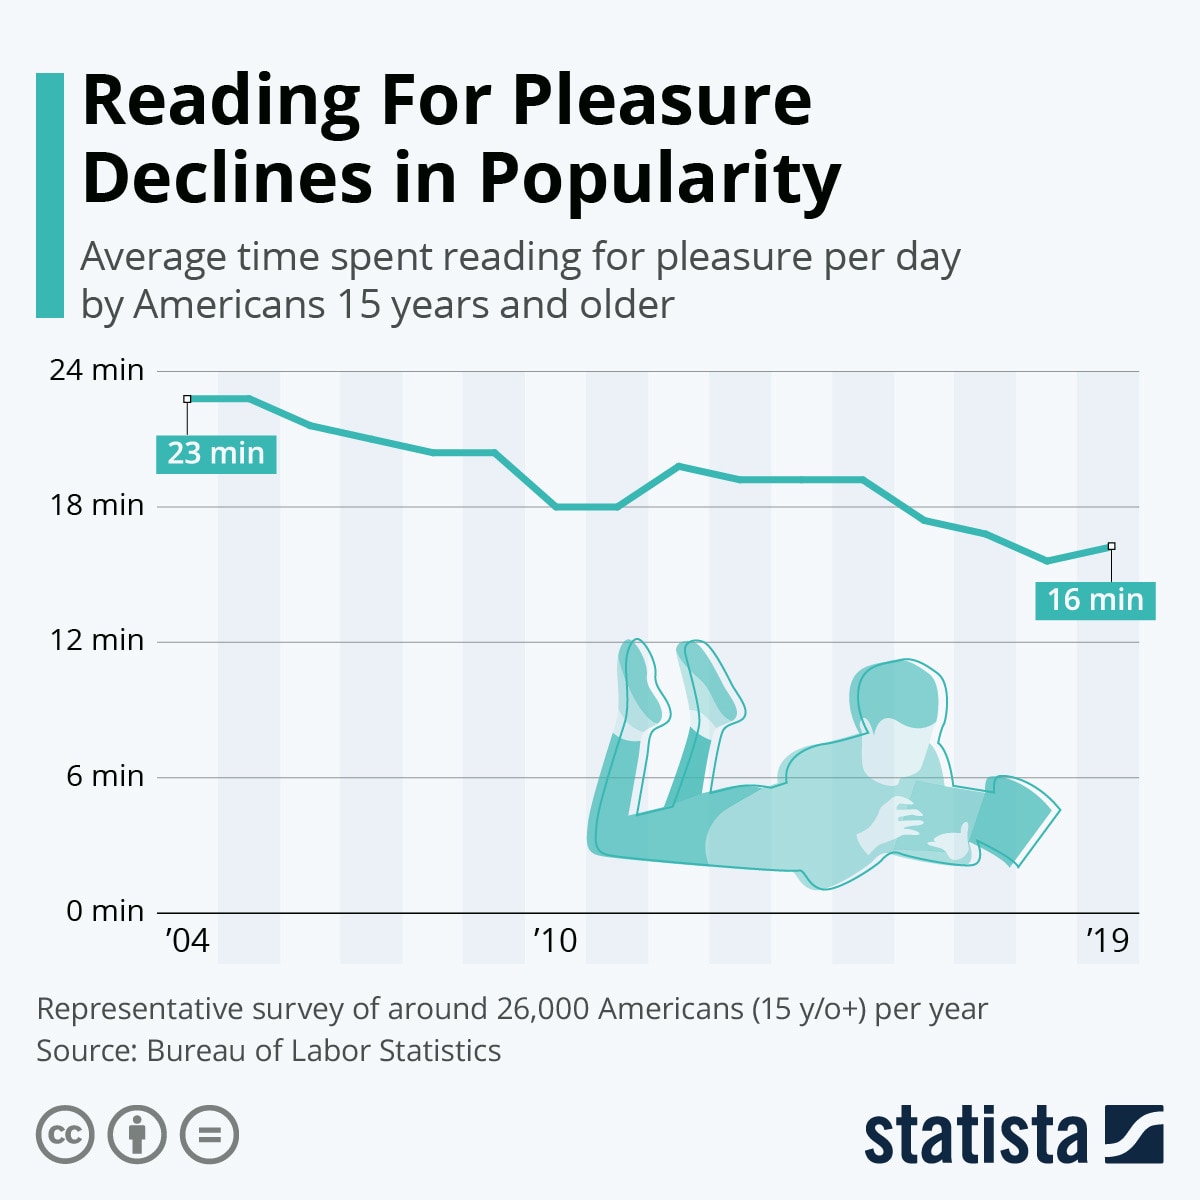
Reading for pleasure declined since 2004 by almost one-third
—
by
The average American spent 16 minutes per day reading for pleasure, down from 23 minutes in 2004.
-
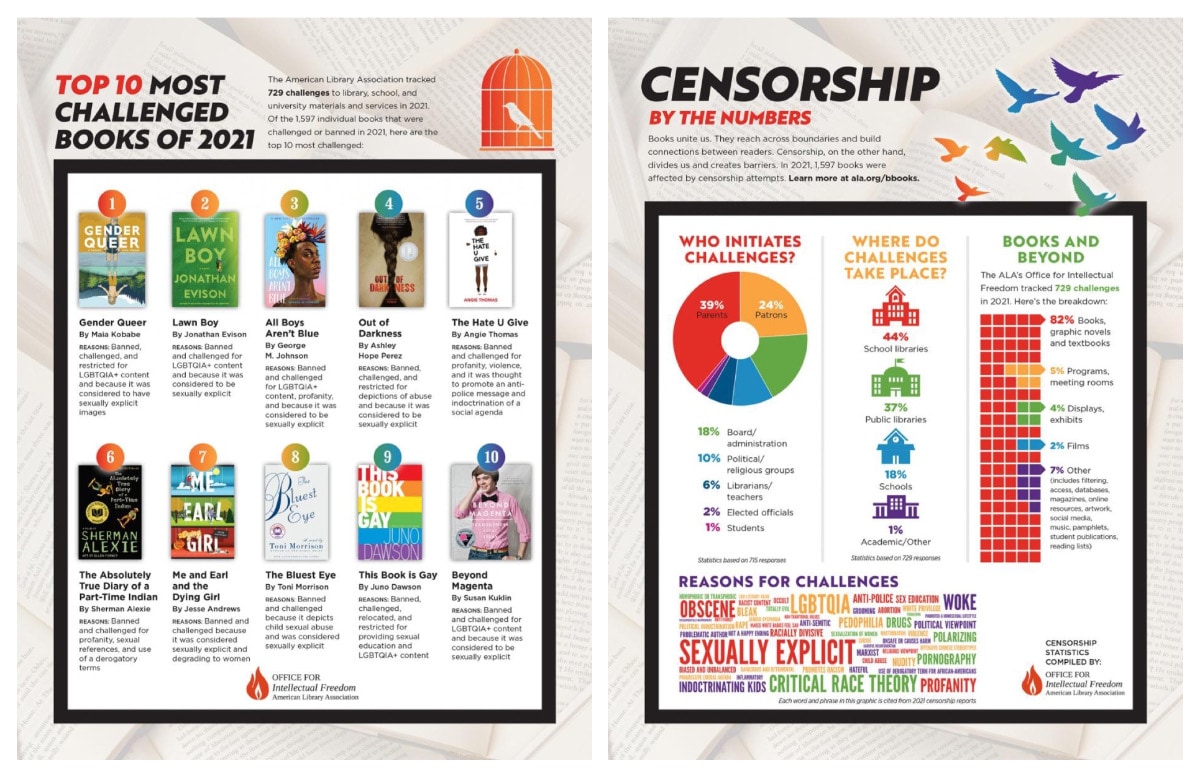
Book censorship in the 2021 by the numbers
—
by
In 2021, 1,597 books were challenged or banned in the United States, according to the newest report by the American Library Association.
-

How to set up and organize a perfect home library (infographic)
—
by
A new infographic includes tips to create a functional in-home library, types of shelving and light, as well as alternative ways to find great reads.
-
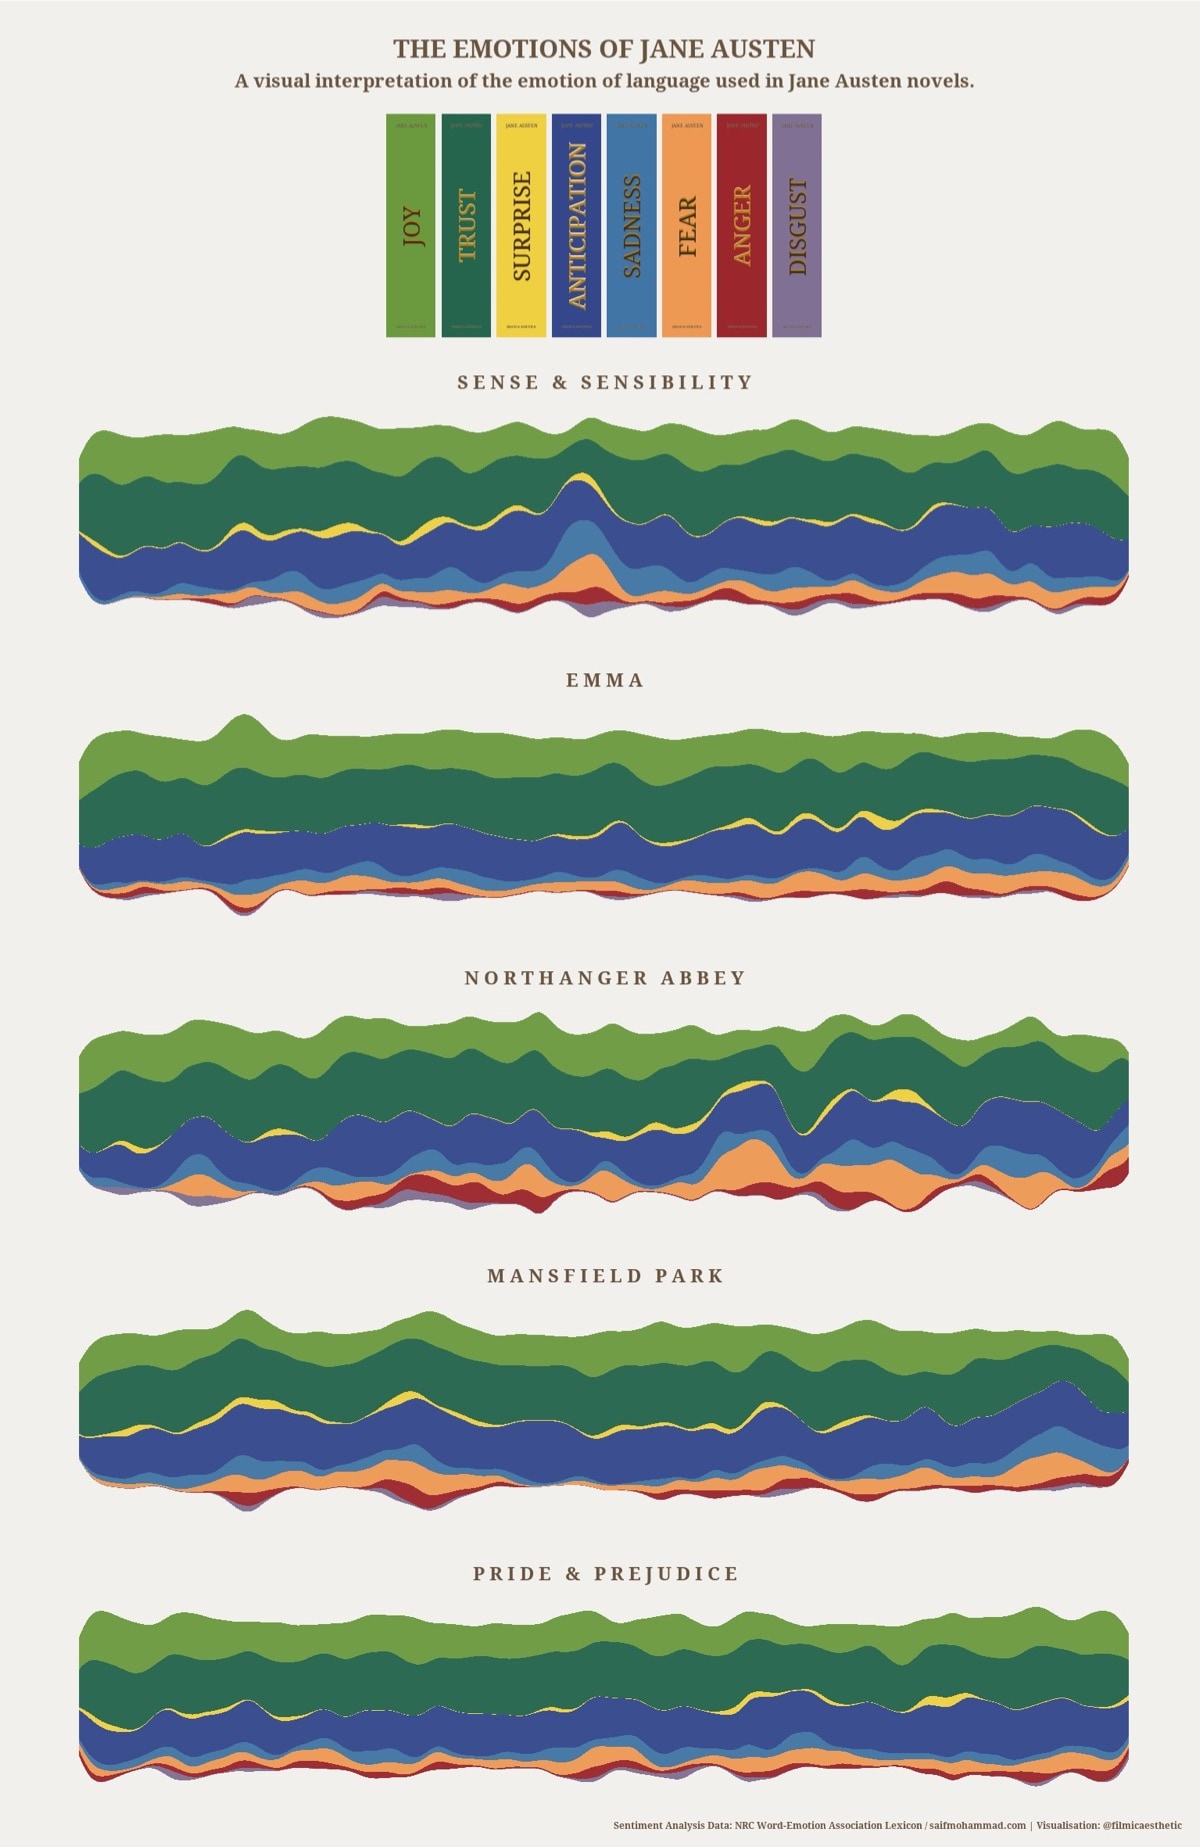
Emotions in Jane Austen’s novels (infographic)
—
by
Joy, trust, and anticipation are the most common emotions in the five most popular novels by Jane Austen.
-
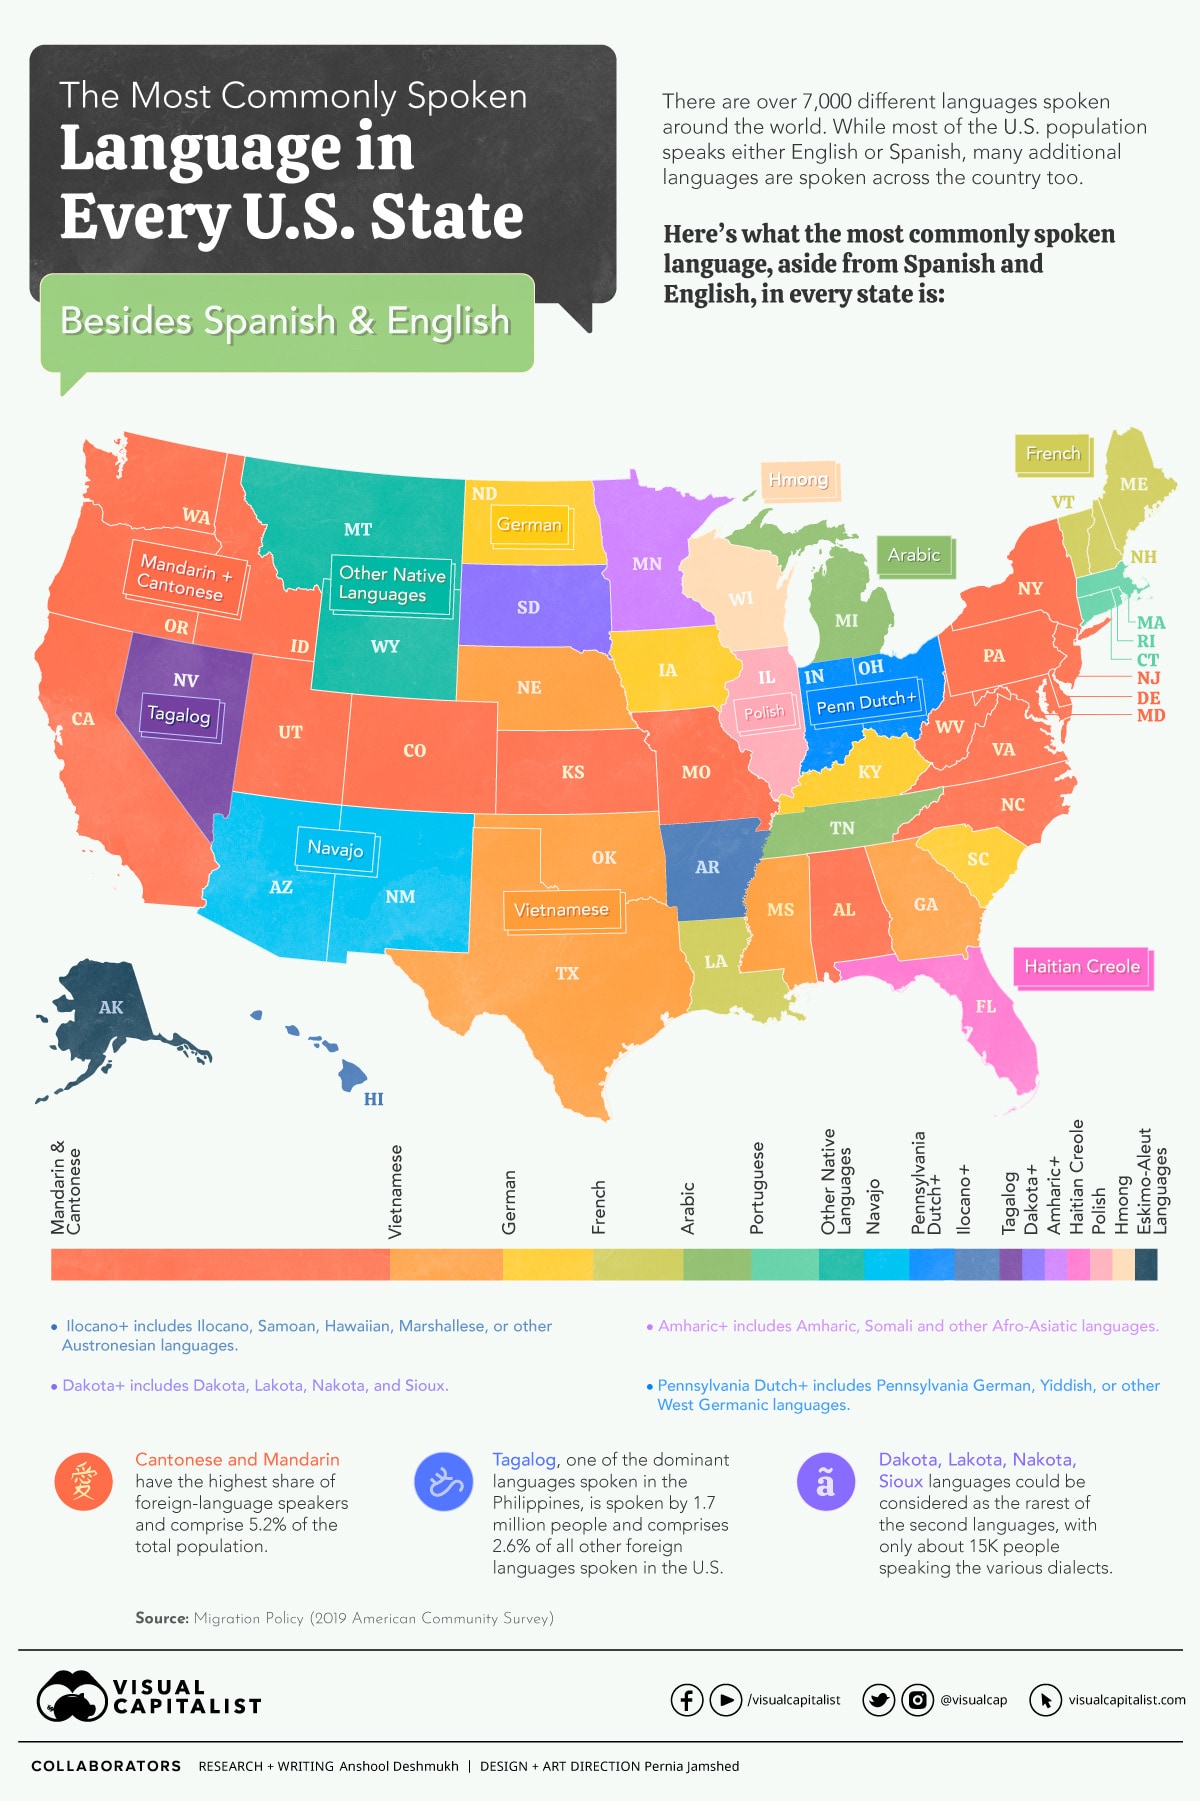
Most popular languages in the U.S., besides English and Spanish (infographic)
—
by
Cantonese and Mandarin, Tagalog, Vietnamese, and Arabic are the most commonly spoken languages, if we don’t count English and Spanish.
-
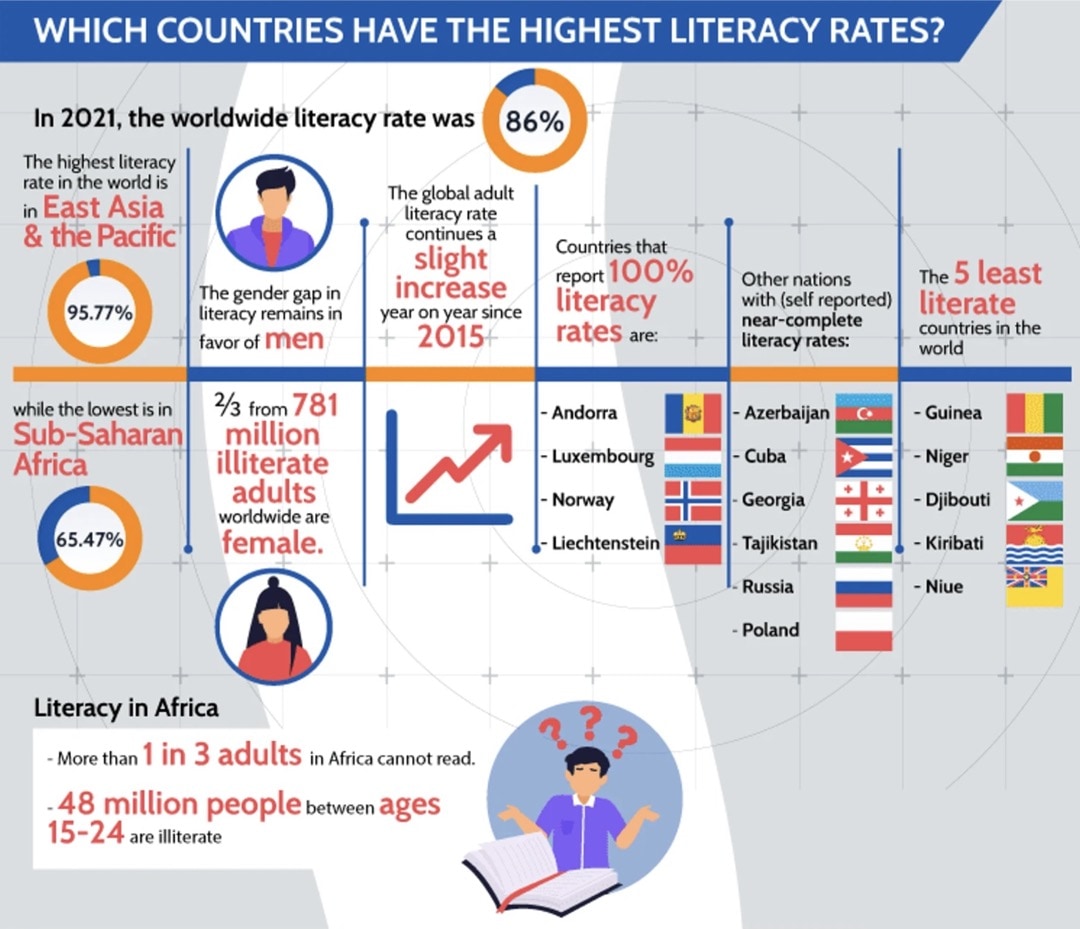
Reading books around the world in 2021 (infographic)
—
by
The most detailed and comprehensive book infographic this year puts together the latest facts and figures about reading habits, literacy rates, and popular books.
-
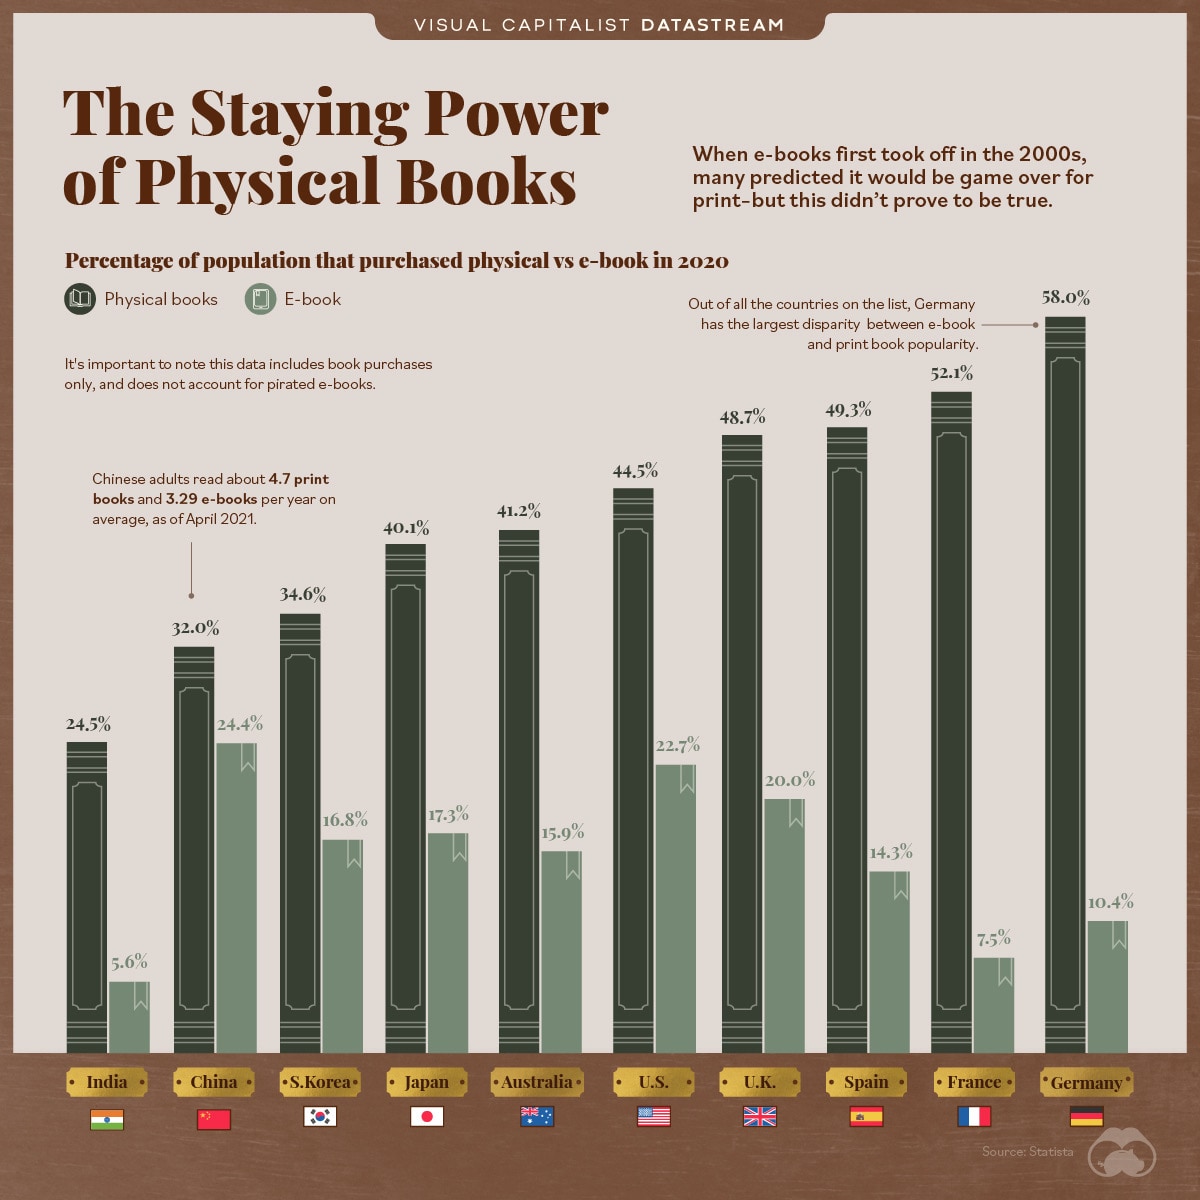
Ebooks are still no match for print books (infographic)
—
by
The newest infographic compares the popularity of printed and electronic books around the world.
-

The evolution of public libraries since 7th century BCE (infographic)
—
by
The newest infographic from PressReader guides us through the milestones in the development of public libraries.

